


You just sent over compliance evidence to the auditor. Their reply? Asking for more information. So you pull some more screenshots and open up spreadsheets you thought were closed for the quarter. If that scramble feels familiar, you have company: how teams collect that evidence is one of the clearest compliance industry trends in our data.
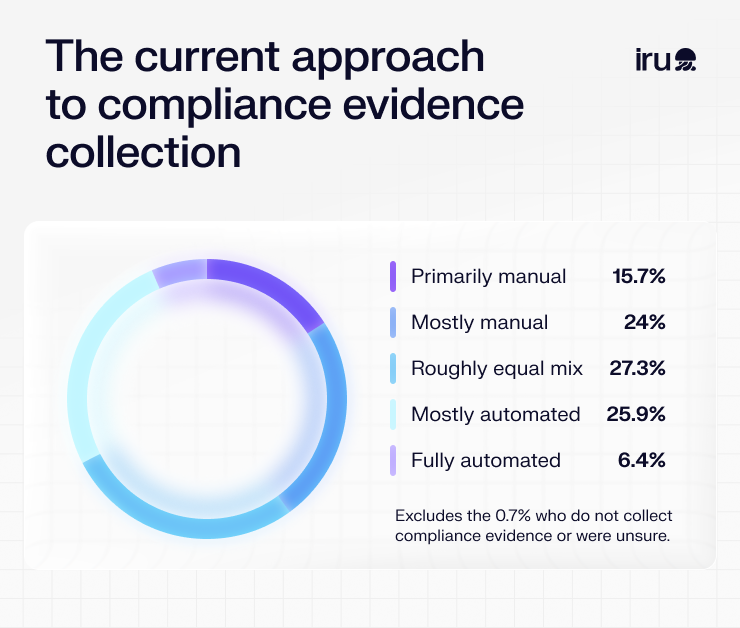
You might assume evidence collection is already handled. After all, about 48.4% of teams describe themselves as continuously audit-ready. But behind that confidence, evidence collection is still largely manual. Only around 6.4% of organizations have fully automated it. Even worse, teams that collect evidence by hand report regulatory fines or formal findings at twice the rate of automated teams.
These figures come from a survey of 860 IT, security, and compliance professionals, mostly at mid-market and enterprise organizations. They show this isn't a budget or appetite problem. Compliance programs have simply expanded faster than the systems supporting them.
Key compliance automation stats
- Only 6.4% of organizations have fully automated evidence collection; 67% are primarily manual, mostly manual, or use a hybrid approach.
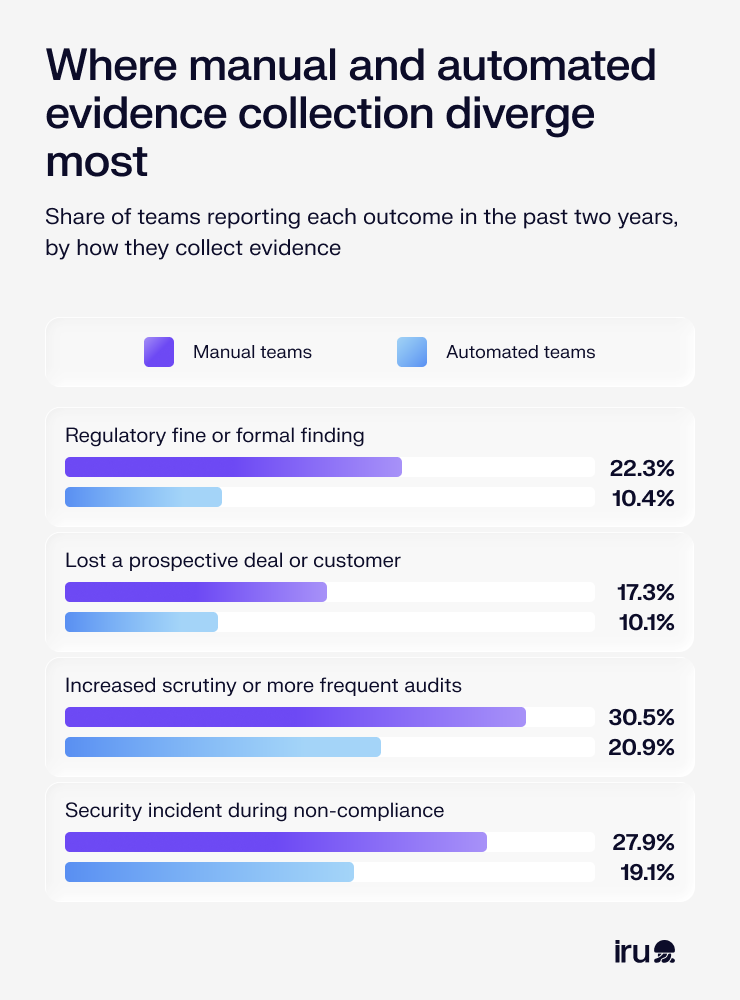
- Teams collecting evidence manually report a regulatory fine or formal finding at 2.14X the rate of mostly or fully automated teams: 22.3% vs. 10.4%.
- 46.6% name a shortage of IT or engineering resources as a top barrier to automating compliance, ahead of budget (34.2%).
- Among organizations that underwent an audit in the past two years (n=831), only 10.7% of teams completed their most recent audit without any auditor follow-up requests. The other 9 in 10 fielded at least one follow-up request.
- Teams that faced a frequent auditor follow-up were more than twice as likely to report a negative business consequence as teams whose first submission was sufficient (92.2% vs. 42.7%).
- Nearly 6 in 10 organizations use AI extensively in compliance, and 40% of those act on its output without mandatory human review – roughly 1 in 4 of all teams surveyed.
81% of manual evidence collectors report at least one negative consequence
Throughout this report, “manual teams” refers to organizations that collect compliance evidence primarily or mostly by hand, while “automated teams” refers to those that are mostly or fully automated. The 27.3% who run an even split are reported separately, not folded into either group.
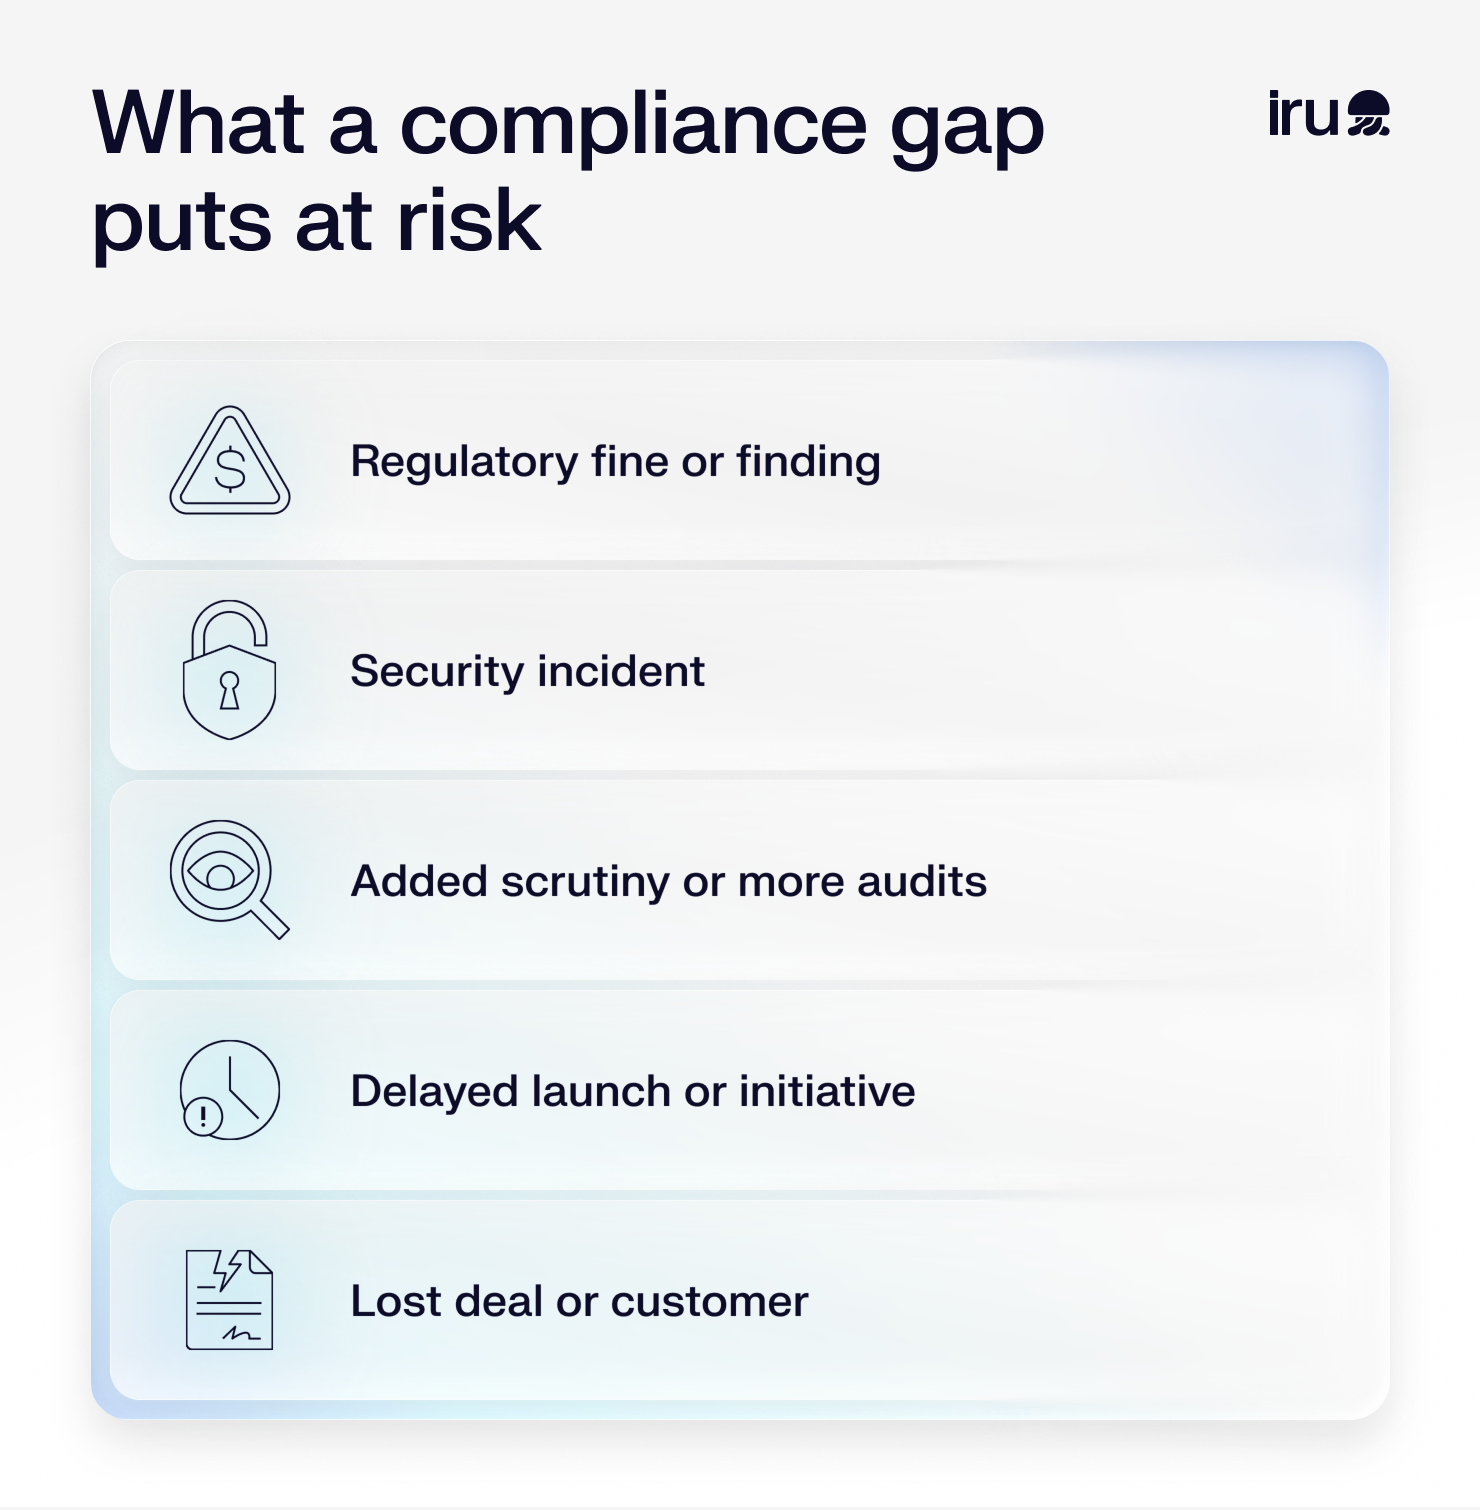
Manual teams don’t just report more fines (2.14X the rate – 22.3% vs. 10.4%); the gap runs across consequences of every kind. 81.2% of manual teams report at least one negative consequence tied to a compliance gap or failed audit readiness. Compare this with automated teams, which report 69.4%.
Manual teams also report more consequences at once. The average manual team named around 2.2 distinct consequences over two years, versus 1.63 for automated teams. The same pattern shows up at the task level: teams that have mostly or fully automated 7 or more of the 10 compliance tasks we surveyed came through clean at a rate of 31.5%, versus 19.5% for teams that automated 2 or fewer.
This doesn’t prove that automating a single workflow prevents fines, but the association is telling. Some of this gap could come down to who the manual teams are. Teams that manage more frameworks report more consequences, and they’re also more likely to collect evidence by hand. So we compared teams carrying a similar framework load. The gap held for teams managing six or more frameworks: manual teams reported a negative consequence 13 to 18 points more often than automated teams.
Only 6% of compliance teams have fully automated their evidence collection
Most compliance programs still run on manual work. Just 6.4% of organizations have fully automated evidence collection, while 25.9% are mostly automated. This puts 32.3% of the market in the automated camp.
The rest (39.7%) collect evidence primarily or mostly by hand, while about 27.3% run a roughly even split. Together, that means about two-thirds of organizations (67%) still do a meaningful share of evidence collection manually.
When we break this down task by task, the same split appears across the 10 core compliance tasks we surveyed. The tasks furthest along are the ones IT owns end-to-end: cloud-based compliance, device posture, and vulnerability scanning all sit at or above 50%. Each runs on a system IT already operates, and that system produces the record as it works.
The other seven tasks sit between 32% and 39%, and they share a trait. Each depends on people or systems outside IT. Policy acknowledgment and training depend on every employee. Access reviews depend on managers and app owners. Vendor risk depends on third parties. Evidence mapping draws from all of them and still needs a human to review it.
Automation stalls where compliance work crosses from one team’s system to another’s. That’s the gap a single platform for IT, security, and compliance is built to close. Here’s a task-by-task breakdown of our findings:
| Compliance task | Mostly or fully automated | Mostly or fully manual |
|---|---|---|
| Cloud-based compliance | 52.8% | 26.3% |
| Device posture checks | 50.2% | 26.8% |
| Vulnerability scanning and remediation tracking | 50.2% | 24.0% |
| Employee security training completion tracking | 39.4% | 32.7% |
| Audit report generation | 38.4% | 31.1% |
| Compliance certification maintenance and publishing | 38.3% | 29.2% |
| Policy tracking and acknowledgment | 37.0% | 37.2% |
| Evidence collection and mapping to controls | 34.9% | 32.7% |
| Access reviews and user provisioning audits | 33.0% | 32.8% |
| Third-party vendor risk assessments | 31.6% | 32.1% |
Even the top task, cloud-based compliance, is mostly or fully automated at 52.8%. That leaves nearly half of organizations doing at least part of it by hand. Evidence collection itself ranks eighth among the ten tasks in terms of automation, at 34.9%.
This is not a market that resists new technologies. AI adoption in compliance is effectively universal. Around 89.1% use AI-powered features in compliance tools, while 59.0% use them extensively and only 1.6% actively avoid them. Instead, teams run AI inside tools to draft policies, summarize controls, and answer security questionnaires. So teams have adopted AI; they’re just not automating the work underneath it.
Nearly half of teams say they lack the engineers to automate compliance
When we asked what was preventing teams from automating more of their compliance workflows, the top answer was not budget; it was people: nearly half of teams (46.6%) named a lack of IT or engineering resources to implement and maintain automation tools.
Close behind at 42.0% was the belief that compliance requirements are too specific or nuanced to automate reliably. Budget constraints rank third, at 34.2%.
| Barrier to automating compliance | Share of teams |
|---|---|
| Lack of IT or engineering resources | 46.6% |
| Compliance requirements feel too specific or nuanced to automate reliably | 42.0% |
| Budget constraints | 34.2% |
| Too many existing tools; it would be hard to integrate another | 27.0% |
| Leadership hasn't prioritized compliance automation | 23.0% |
| Uncertainty about which tasks to automate | 22.4% |
| Bad experience with a compliance automation tool in the past | 15.2% |
| None; current tools cover our needs | 13.4% |
The 42.0% who say compliance is too nuanced to automate are worth a closer look. It's a working belief about the nature of the job that the rules are too situational for a system to handle.
But the teams that automated anyway tell a different story. As the consequences we’ve covered show, they report fewer regulatory fines, formal findings, and negative consequences overall. Automation is keeping up with the complexity of compliance, as shown by fewer fines and fewer last-minute scrambles to produce evidence.
The “too many existing tools” barrier deserves attention too. Teams don’t want yet another point tool to bolt onto the stack. They would benefit more from consolidating what they already have than from connecting something new.
9 in 10 audits come back with follow-up requests
Among organizations that underwent an audit in the past two years (n=831), only about 10.7% reported that their initial submission was complete and sufficient. The other nine in ten fielded at least one follow-up request.
A majority of teams (58.4%) described a moderate amount of back-and-forth, and another 30.9% reported significant back-and-forth with many follow-up requests. For close to a third of teams, the audit is a drawn-out exchange rather than a single handoff. Figures in this section are based on the 831 organizations that underwent an audit in the past two years, excluding 19 that had not been audited in that period and 10 that were unsure.
The amount of follow-up a team faces shows the widest gap in business outcomes among all factors we measured, though it signals damage rather than causing it. Teams that faced frequent follow-up reported at least one negative consequence (a fine, added scrutiny, a security incident, a delayed launch, or a lost deal) 92.2% of the time, compared with 42.7% of teams whose first submission was sufficient.
| Factor | Higher-risk group | Lower-risk group | Gap |
|---|---|---|---|
| Frequency of auditor follow-up | 92.2% (frequent follow-up) | 42.7% (clean submission) | 49.5 pts |
| Annual compliance spend | 83.8% ($250K+) | 67.5% (under $50K) | 16.3 pts |
| Evidence collection approach | 81.2% (mostly/fully manual) | 69.4% (mostly/fully automated) | 11.8 pts |
Heavy follow-up and poor outcomes tend to go hand in hand because both reflect a shaky compliance posture, rather than one causing the other.
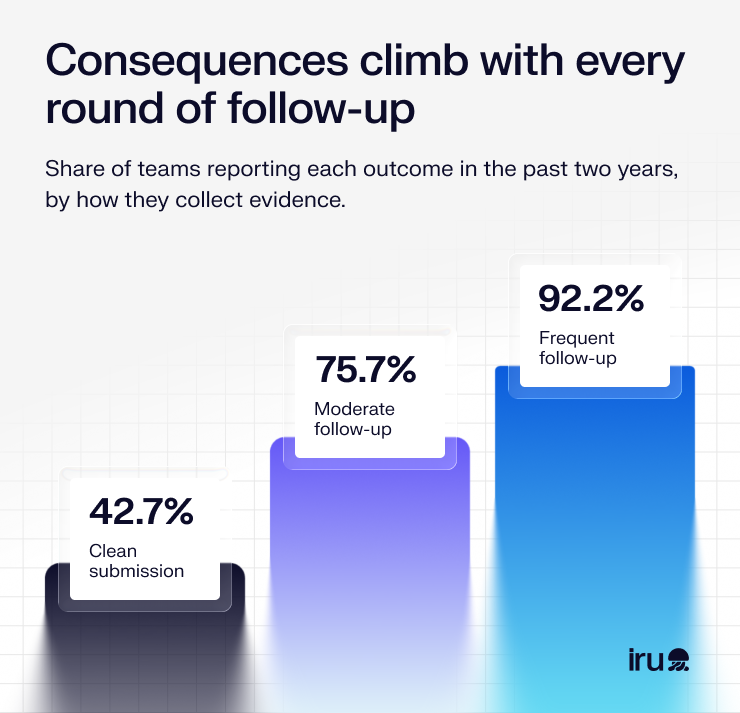
The likelihood of a consequence rises at each level of follow-up, and the average team's consequence count more than triples between a clean submission and frequent follow-up.
The exchange also carries a direct cost. A quarter of teams (26.4%) spend 200 or more hours on compliance work in a typical audit cycle, and a third (32.1%) lost productivity to last-minute audit preparation in the past two years. Unplanned costs to hit a deadline (emergency contractors, overtime, and rush consulting fees) are common across the board: 29.5% of teams reported them, though they don't rise cleanly with follow-up volume the way consequences do.
The follow-up cycle consumes engineering hours and budget on every audit. For teams already stretched thin, this is time taken away from the very work most teams say they lack the capacity to do: building the automation that would shorten the cycle in the first place.
The more compliance frameworks a team manages, the more automation is worth to them
Compliance load is not spread evenly. 71.0% of organizations manage six or more external security, privacy, or regulatory frameworks as formal programs, and 15.7% manage sixteen or more. Each added framework brings its own controls and evidence requests, so the workload climbs with the count: 11.9% of teams managing one to five frameworks spend 200 or more hours per audit cycle, compared with 40.3% of teams managing 16-20 frameworks.
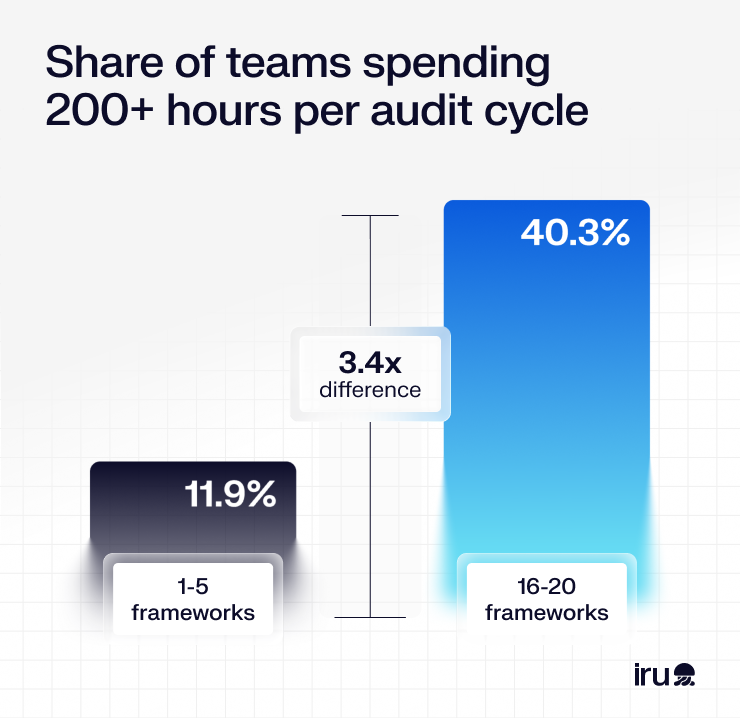
Automation matters more as that load grows. Among teams managing only a handful of frameworks, manual and automated teams report negative consequences at nearly the same rate. The distance opens as the framework count rises:
| Frameworks managed | Manual teams | Automated teams | Difference |
|---|---|---|---|
| 1–5 | 58.6% | 57.1% | 1.5 pts |
| 6–10 | 84.0% | 70.5% | 13.5 pts |
| 11–15 | 93.0% | 78.7% | 14.3 pts |
| 16–20 | 97.2% | 78.9% | 18.3 pts |
Base sizes by band: 1–5 (n=249), 6–10 (n=274), 11–15 (n=202), 16–20 (n=135). Splitting each band into manual and automated subgroups leaves the heaviest-load cells in the tens, so treat the 16–20 gap as directional.
Teams managing 1–5 frameworks show almost no gap. At 16–20, manual and automated teams are 18.3 points apart. Among the heaviest-load group, only about 2.8% of manual teams escaped all negative consequences over two years, compared with 21.1% of automated teams.
The teams carrying the most frameworks are also the least likely to have automated: Nearly 52.6% of teams managing sixteen to twenty frameworks still collect evidence by hand compared with over 40% of teams managing one to five. Automation is most valuable to the very teams least likely to have it.
The organizations with the heaviest compliance load, the most frameworks, the most audit hours, and the most exposure are the ones still assembling evidence by hand. Running endpoint management, endpoint detection and response, identity, and compliance on one platform pays off most where that load is heaviest, because the evidence becomes a byproduct of the system rather than a separate collection project every cycle.
Spending more doesn't mean collecting less by hand
Roughly half of organizations (50.3%) spend $100,000 or more a year on compliance tools, software, and outside help, and 19.1% spend $250,000 or more. The intuition is that money buys a smoother program. The data does not show this.
More spend doesn't mean less manual work. Teams spending $250,000 or more are about as manual as teams spending a fraction of that: 43.4% of the highest-spending group still collect evidence by hand, compared with 40.4% of the teams spending under $50,000 and 38.8% of those in between. The budget grows while the manual work stays.
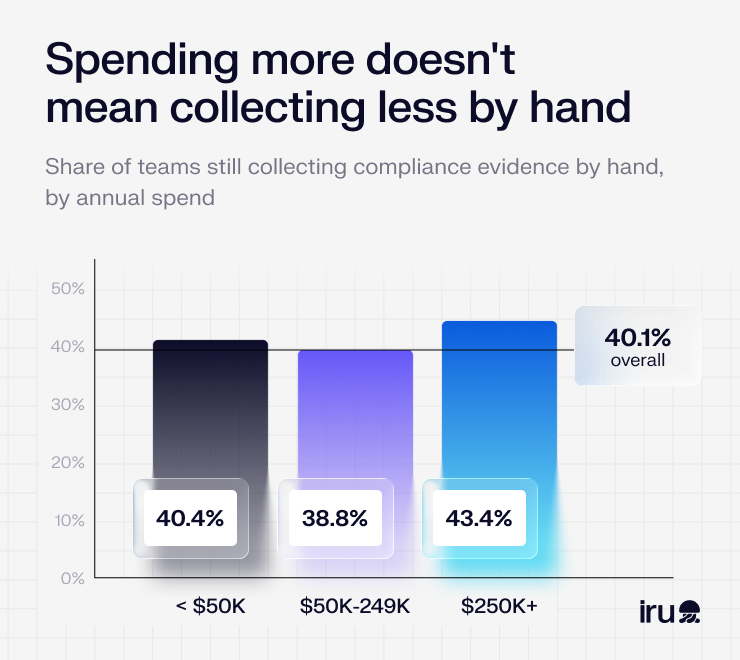
More money doesn’t buy fewer consequences, either. Here’s how the highest and lowest spenders compare:
| Outcome (past two years) | Spends $250K+ | Spends under $50K |
|---|---|---|
| At least one negative consequence | 83.8% | 67.5% |
| Unplanned rush costs (contractors, overtime, rush consulting) | 35.6% | 23.7% |
| 200+ hours per audit cycle | 44.7% | 4.9% |
| No negative consequences at all | 15.0%* | 29.8%* |
* Rows don’t sum to 100%: a small share preferred not to say (1.2% of the $250K+ group, 2.7% of the under-$50K group), counted in neither “at least one” nor “none.”
At first glance, this table seems to suggest spending more money causes more problems, which may not be the real story. What spend actually tracks is scale and scope. Annual spend of $100,000 or more climbs from 18.3% of companies under 100 employees to 69.6% of those with 5,000 or more, and from 32.8% of teams managing one to five frameworks to 62.7% of teams managing sixteen to twenty.
Bigger, more heavily regulated organizations spend more because they have more to cover, and they carry more consequences because they carry more surface area, not because the spending backfired.
The money follows framework count and headcount, so it buys more tools and more coverage without changing how evidence gets collected. An organization can spend more than $250,000, add another point tool for each new framework and still have its team assemble audit evidence by hand every cycle. Spend scales the program’s size. It does not, on its own, make the program self-sustaining. In Iru’s view, collapsing the stack onto a single platform, rather than adding another point tool, is what changes that.
4 in 10 teams using AI extensively in compliance act on its output without mandatory human review
AI has reached almost every compliance program. 89.1% of organizations use AI-powered features in their compliance tools in some form, and only 1.6% actively avoid them. Nearly six in ten (59.0%) use AI extensively rather than experimentally.
Among the 507 organizations using AI extensively, 39.8% act directly on its output, with no mandatory human review before taking action. That works out to 23.5% of all teams surveyed, roughly one in four, acting on AI-generated compliance work without a required human check. The largest single group, about 36.1% of all teams, use AI extensively while keeping a review step in place, so the market hasn’t settled on a shared norm yet.
Spending intent tracks AI posture, though the two aren’t the same thing. Appetite to invest is nearly universal: 54.5% of teams are very likely to increase compliance automation spend in the next 12 months, and another 40.7% are somewhat likely. The more heavily a team leans on AI, the more likely it is to raise its automation budget:
| AI posture | Very likely to increase spend |
|---|---|
| Extensive use, no mandatory review | 84.2% |
| Extensive use, human review required | 60.1% |
| Selective or experimental use | 35.4% |
| Not using AI | 26.6% |
Current automation maturity does not predict investment intent. About 56.2% of manual teams, 52.8% of hybrid teams, and 55.6% of automated teams are very likely to increase spend, which is effectively flat. Whether a team has actually automated its evidence collection says nothing about how eager it is to spend on automation next year.
Enthusiasm is running ahead of the foundation. Teams plan to spend more on compliance automation, but that spend layers on top of a manual base rather than replacing it. That’s where infrastructure-generated evidence changes the order of operations: when compliance runs on the same platform that manages the endpoints, the underlying record is automated before any AI, or any new spend, is layered on top.
Teams that have automated device posture checks are 2.7X as likely to have automated compliance evidence collection
Some compliance work is a natural fit for automation. Other kinds resist it. Tasks a system can observe on its own are the most automated, while those that require a person to attest or judge are the least automated.
The difference is part of why posture tracks so closely with broader compliance maturity. Among teams that have mostly or fully automated device posture checks, 47.3% have also automated their evidence collection overall, versus 17.6% who haven’t, about 2.7 times the rate.
Device posture is one of those tasks: It generates a continuous, system-verified record instead of a point-in-time screenshot that a person has to capture and produce again at audit time.
Device posture checks (confirming OS version, encryption, screen lock, and similar settings across the fleet) sit at the automated end. 50.2% of teams have mostly or fully automated them, tying with vulnerability scanning for second among the ten tasks, just behind cloud compliance. Even so, about 26.8% of teams still handle device posture mostly or fully by hand, and another 22.4% run an even split, which means roughly half of organizations are still checking device state manually in some form.
As the task breakdown earlier showed, the most automated tasks rely on evidence that already exists in a system. Automating them is simply a matter of reading what the platform can already see. The least-automated tasks (evidence collection & mapping, access reviews, and vendor risk assessments) rely on human judgment and sign-off, which are harder to automate, and most teams are still doing the work by hand.
When the platform that manages the endpoint also produces compliance evidence, device posture is no longer a task but a continuous output. No one collects screenshots for encryption status, OS version, or lock settings, because that evidence was never separated from the system that enforces it.
Automate compliance evidence collection with Iru
The through-line of this report is a mismatch. Teams have the budget, since 50.3% spend more than $100,000 per year. They have the AI, since nine in ten use it. What most lack is automated evidence collection, and teams without it report more fines and more consequences overall, especially as their framework load grows. The money and the technology arrived. The underlying workflow stayed manual.
That mismatch persists because compliance evidence has been treated as a separate project, assembled by hand each cycle, rather than something the systems already in place produce on their own. The task data shows where it breaks down: at the handoffs between teams. Adding another point tool only adds another handoff.
When Endpoint Management, EDR, Workforce Identity, and Compliance Automation run on one platform, the handoffs disappear. The record of device state, access, and remediation is generated continuously, as a property of the system rather than a quarterly scramble.
Understanding these compliance industry trends is the first step. Acting on them is what separates the teams that submit clean from the teams still chasing screenshots. See how Iru’s AI-native Compliance Automation turns endpoint data into continuous, audit-ready evidence, or explore the full compliance platform to see where it fits your stack.
Methodology
The survey was conducted by Centiment for Iru. The survey was fielded between June 16, 2026, and June 17, 2026. The results are based on 860 completed surveys. Data is unweighted, and the margin of error is approximately ±3.3% for the overall sample at a 95% confidence level.
Respondents are US-based IT, security, and compliance professionals; 92.6% are at organizations with 100 or more employees. Some figures use a smaller base: spend figures are based on the 837 respondents who reported a spend range, and audit follow-up figures on the 831 who had undergone an audit in the past two years.